Project Visualization
Watch your AI-powered workflow come to life with real-time, interactive visualization of your entire project hierarchy.
Overview
The Visualize page provides a comprehensive, real-time view of your project's workflow execution. See every phase, milestone, sprint, and task as interconnected nodes in an interactive graph that updates live as the AI works on your project.

Complete project hierarchy visualization with phases, milestones, sprints, and tasks
Workflow Control Panel
The floating control panel gives you complete control over your workflow execution. Start, pause, resume, or stop the AI workflow at any time.
Control Actions
Start Workflow
Begin the AI-powered project execution from the current phase
Pause/Resume
Temporarily halt the workflow and resume when ready
Stop Workflow
Completely stop the current workflow execution
Execution Mode
Switch between Continuous and Phased execution modes

Advanced control panel with execution mode selection
Execution Modes
🚀 Continuous Mode
The AI works through all phases automatically without stopping. Best for projects where you want hands-off execution from start to finish.
⏸️ Phased Mode
The AI pauses after completing each phase, waiting for your review and approval before continuing. Ideal for projects requiring human oversight at each stage.
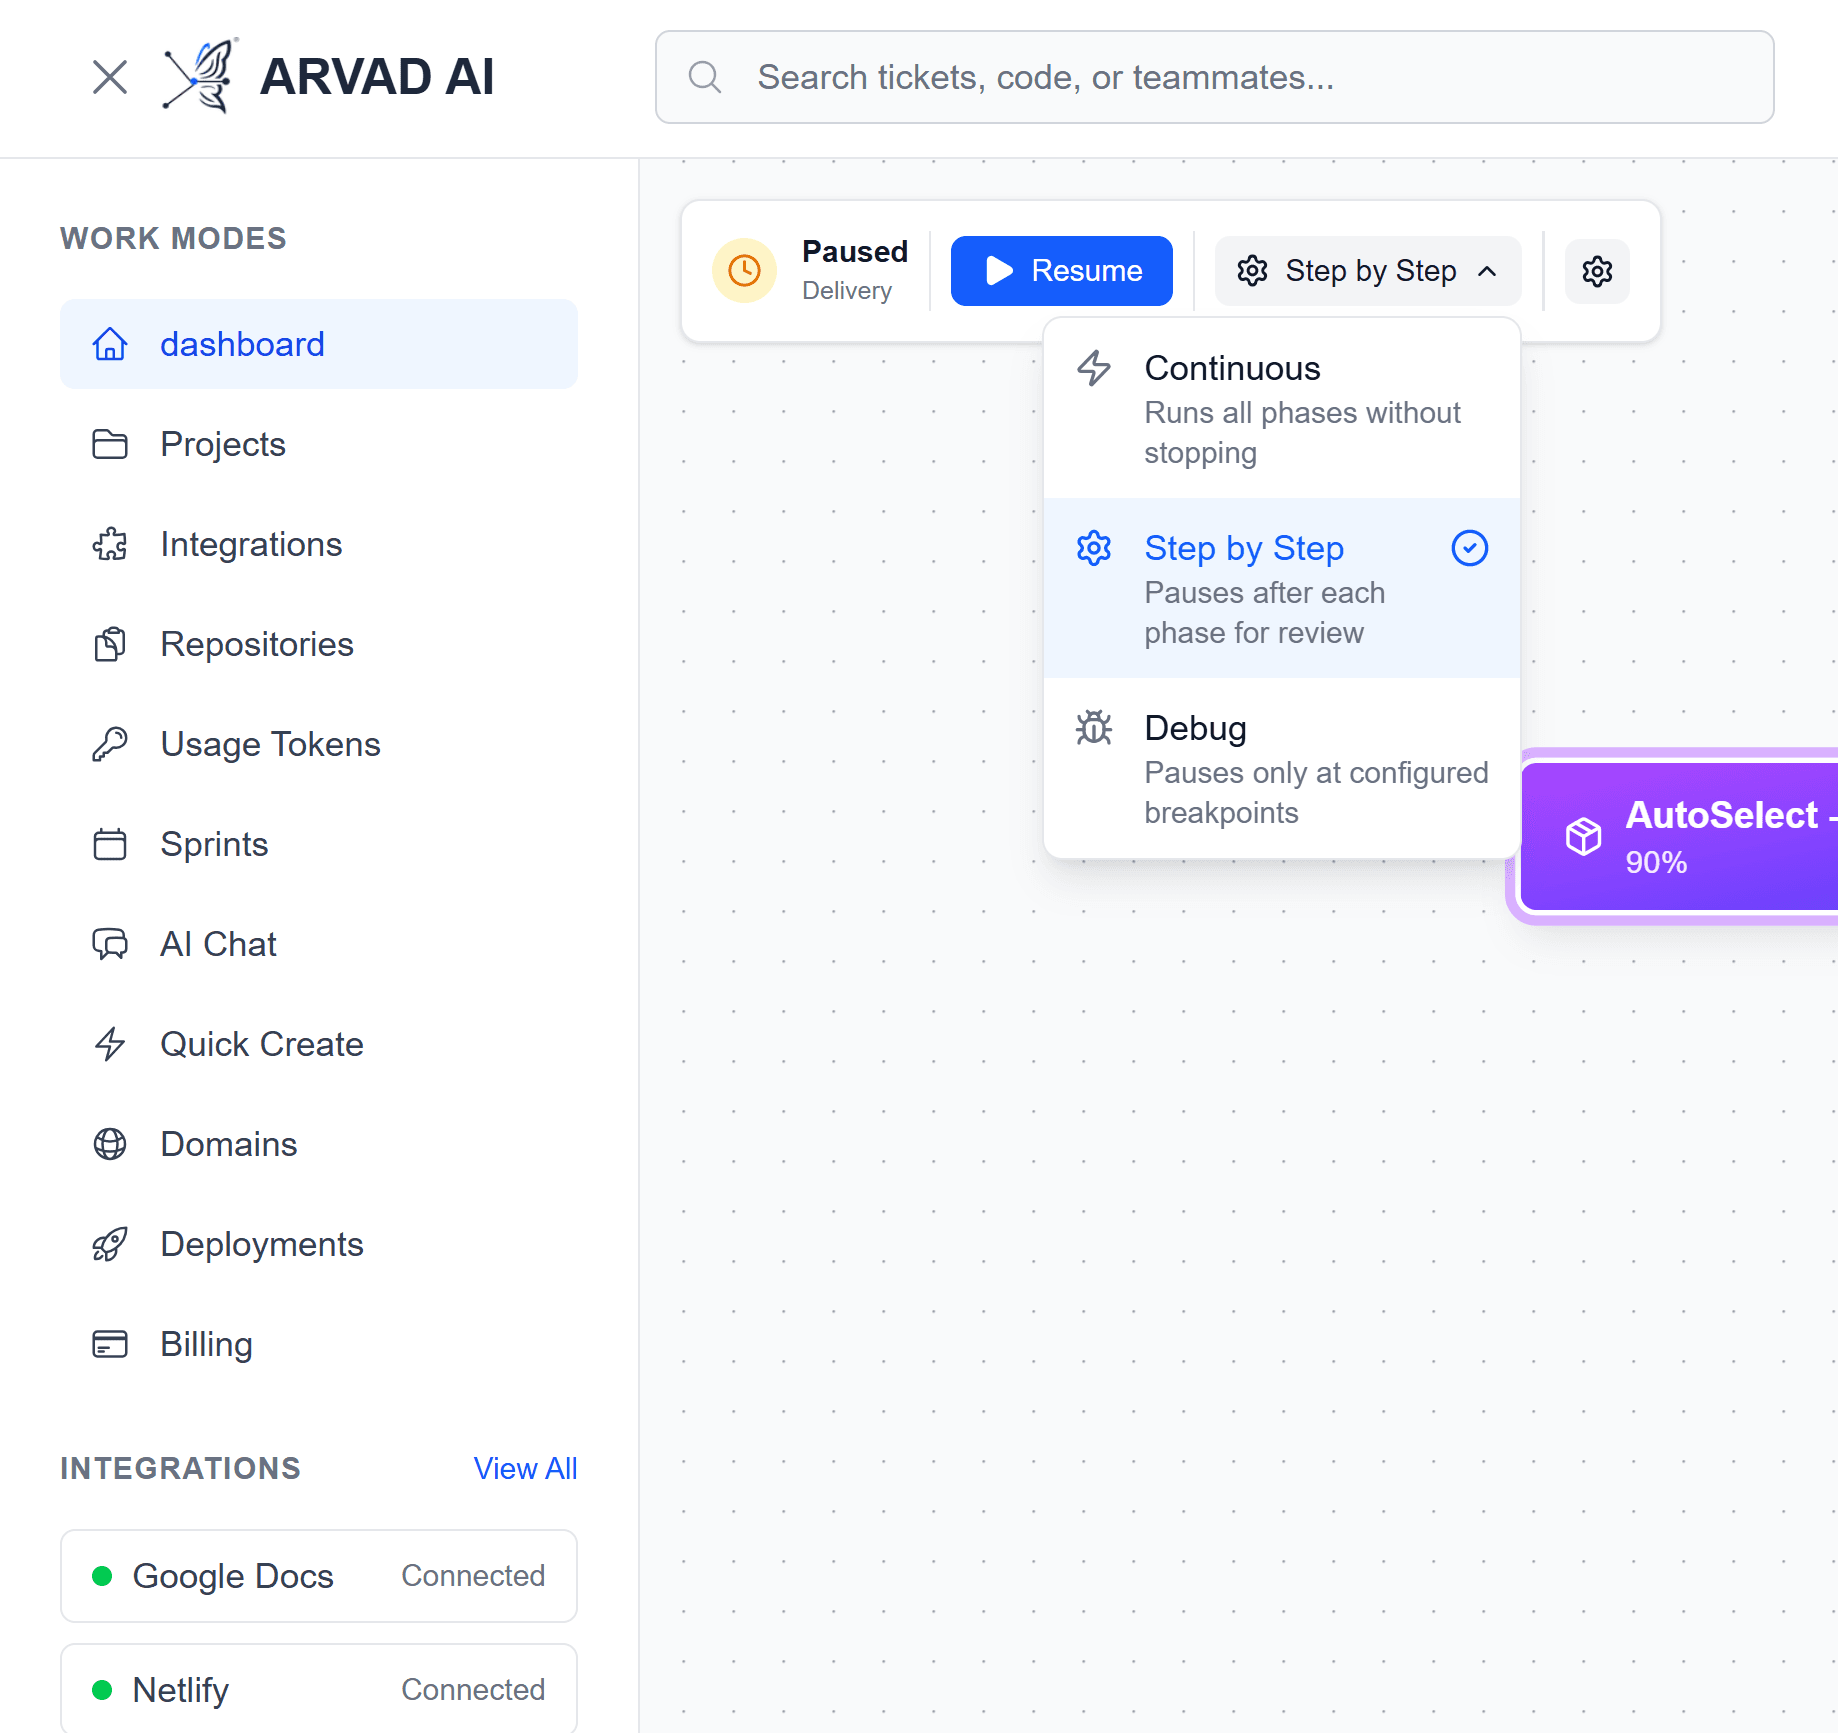
Select between Continuous and Phased execution modes
Interactive Node Graph
Every element in your project is represented as an interactive node. Click on any node to view details, track progress, and take actions.
Node Types
Project Node
The root node showing overall project status, progress, and settings
Milestone Nodes
Key deliverables with their associated sprints and completion status
Sprint Nodes
Sprint containers grouping related tasks together
Task Nodes
Individual work items with status, assignee, and code changes

Project Node

Milestone & Task Nodes
Detail Modals
Click on any node to open its detail modal. Each modal provides comprehensive information and actions specific to that element type.
Project Details

View project settings, progress, and configuration
Milestone Details

Track milestone progress, view sprints, and manage deliverables
Task Details

Task overview and status
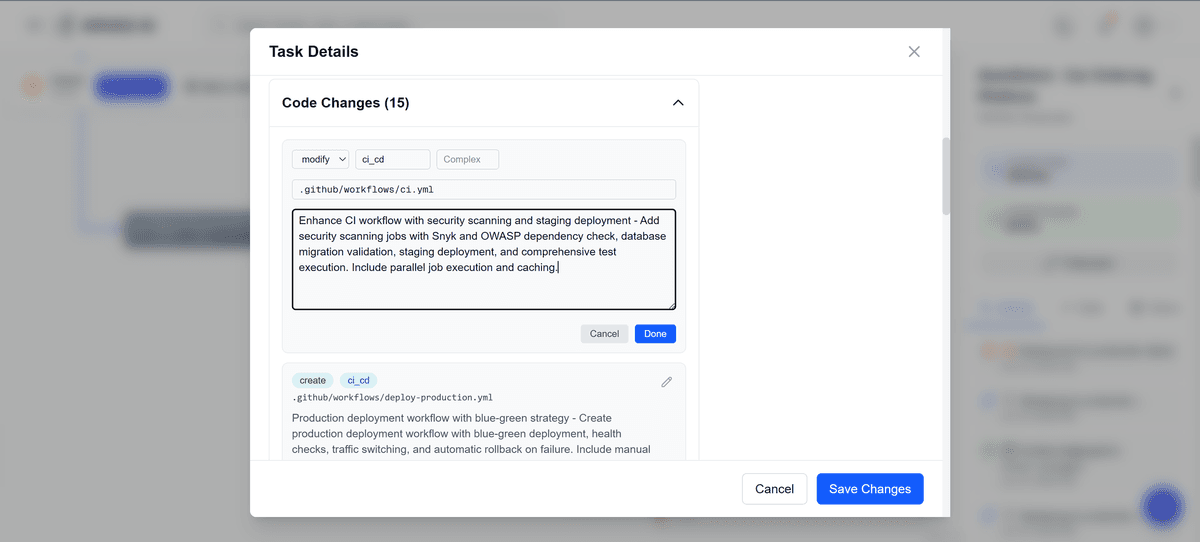
View and edit code changes
Advanced Features
Skip Phase
Need to skip ahead? The Skip Phase feature allows you to bypass the current phase and move directly to the next one.

Rollback Phase
Made a mistake or need to redo a phase? Rollback to any previously completed phase and re-execute from there.

Select target phase
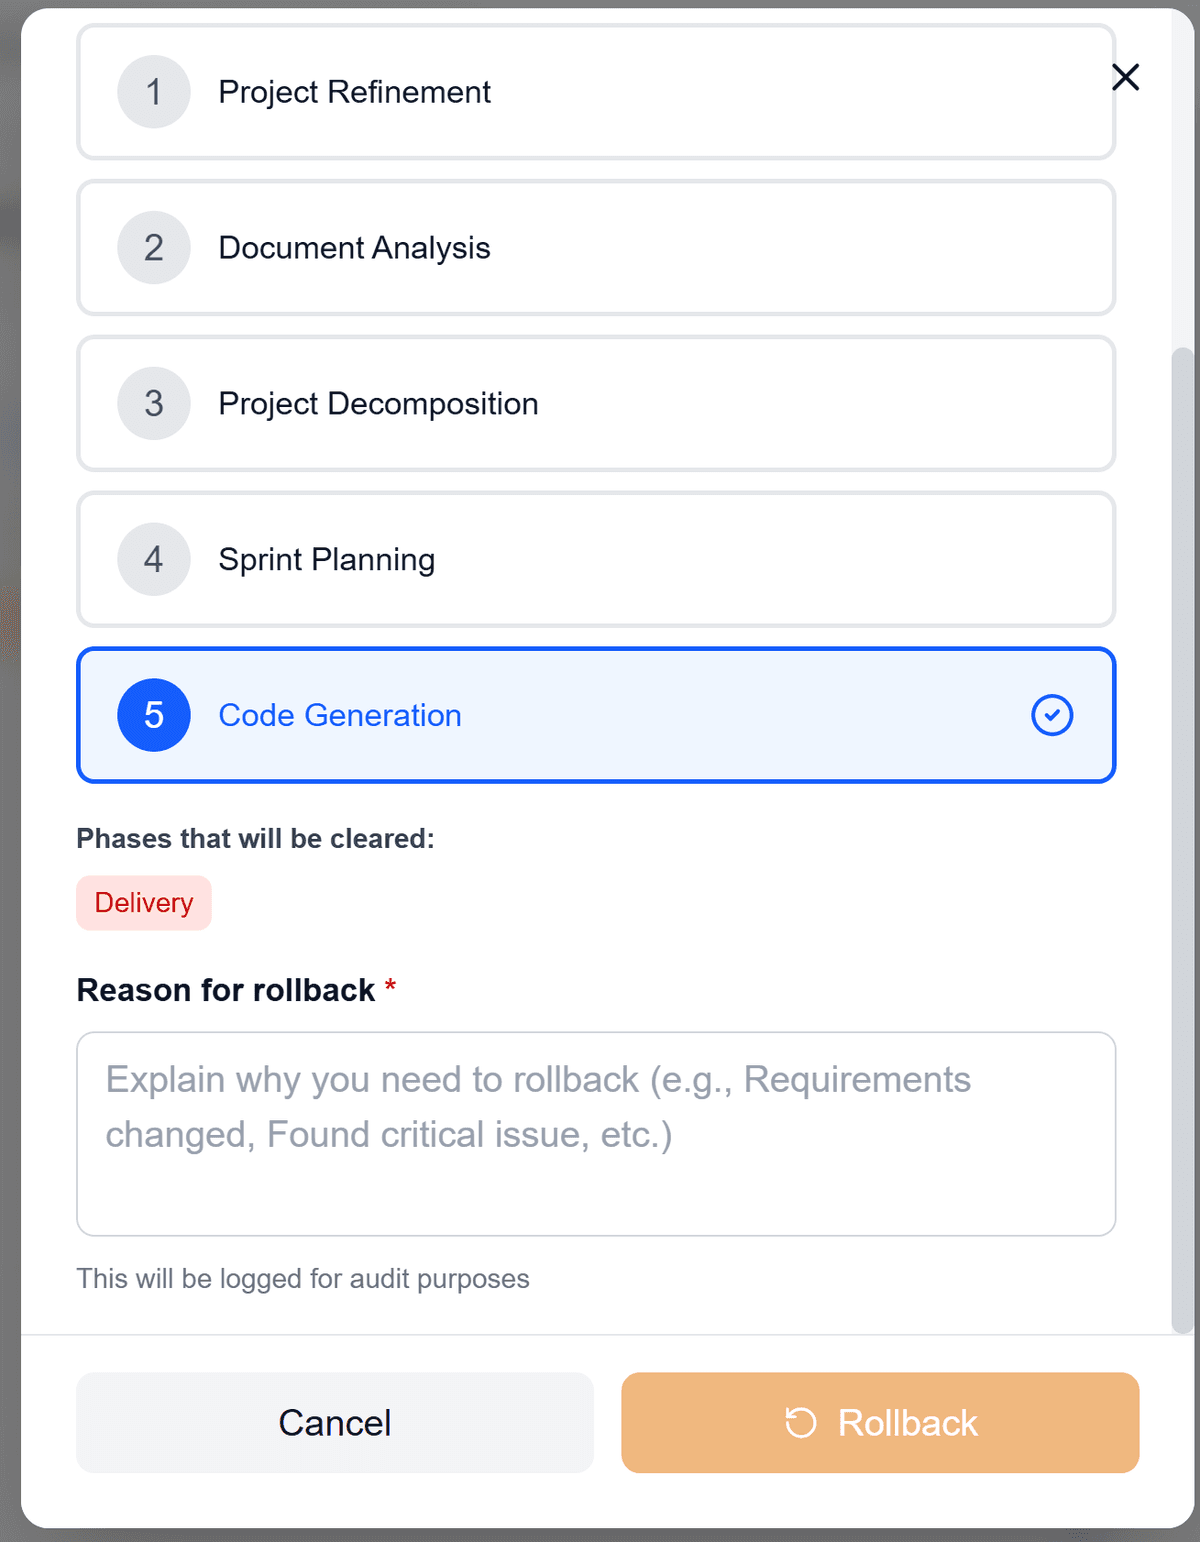
Provide rollback reason
Fullscreen Mode
For maximum focus and visibility, toggle fullscreen mode. Collapse both sidebars for an immersive visualization experience, perfect for presentations or detailed analysis.

Fullscreen mode with sidebar visible
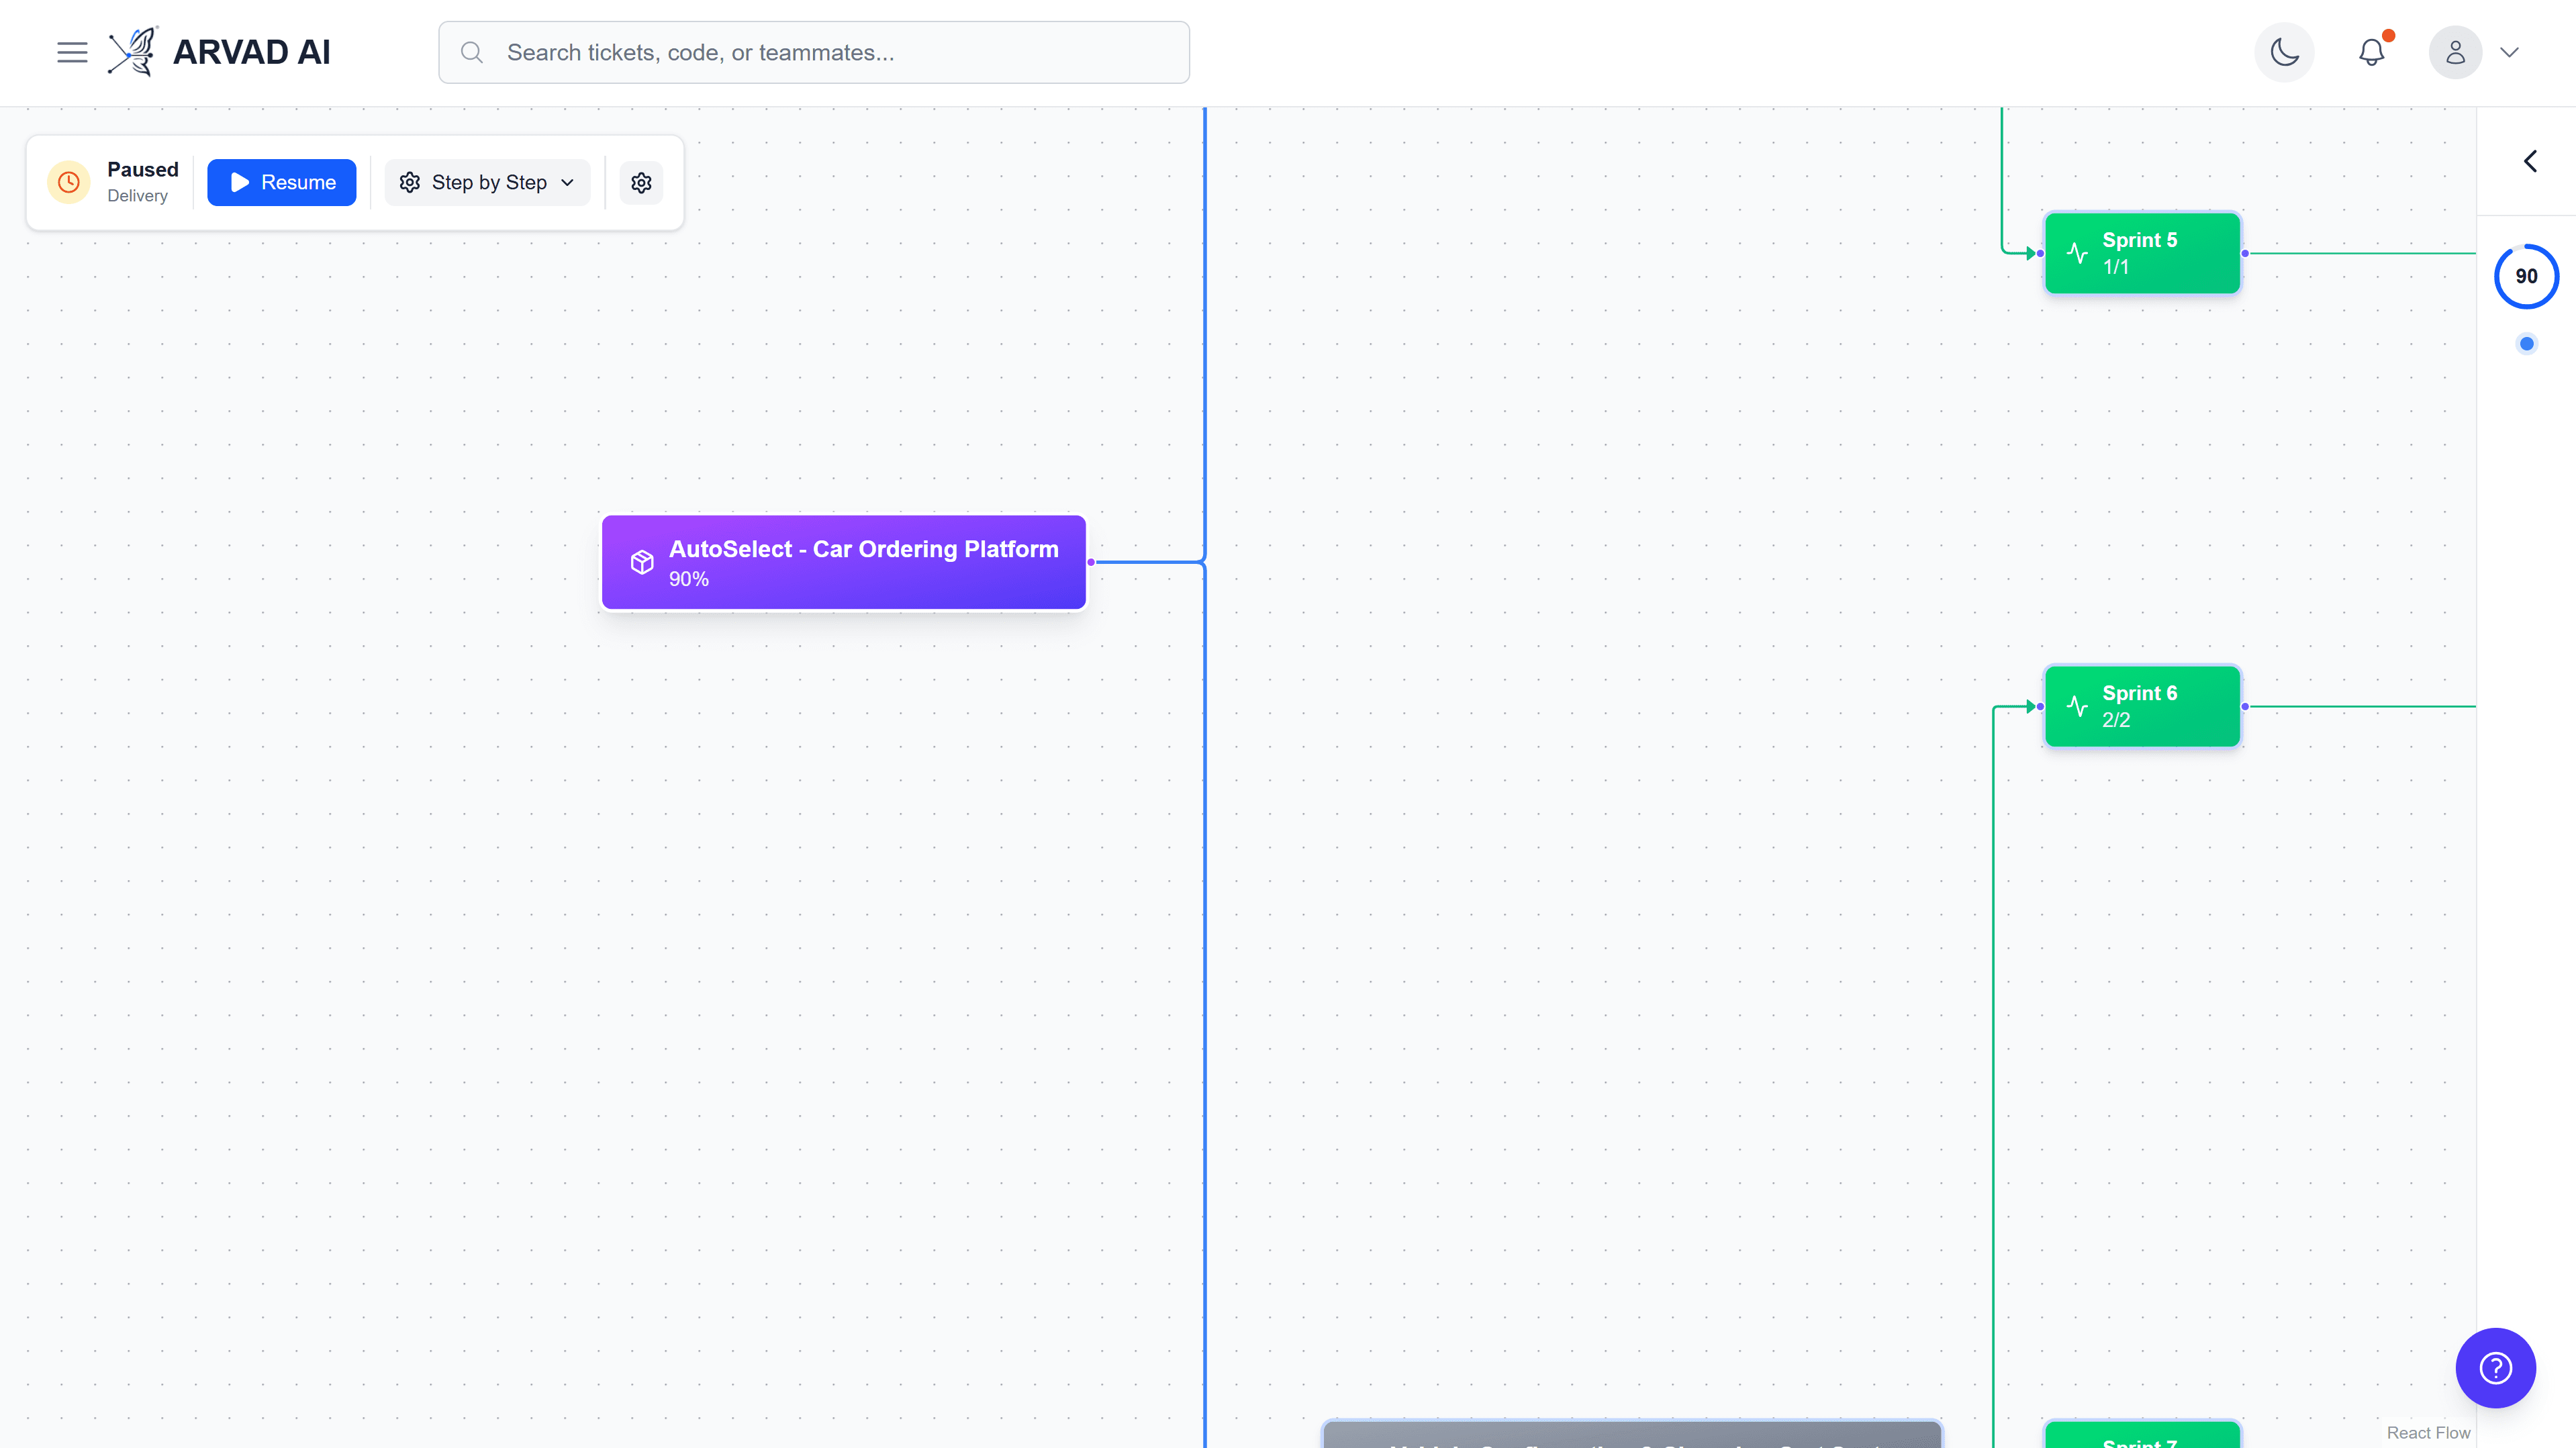
Fullscreen with all sidebars collapsed for maximum canvas space
💡 Pro Tips
- ✓Use mouse scroll to zoom in/out on specific areas of the graph
- ✓Drag the canvas to pan around large project hierarchies
- ✓Click on edges (connecting lines) to see the relationship between nodes
- ✓Use the Activity tab in the sidebar to see real-time workflow updates
- ✓The Statistics tab shows completion percentages for milestones, sprints, and tasks